Tirzepatide and Muscle Loss: What the Studies Really Show
Direct answer
Tirzepatide-associated weight loss includes a reduction in lean mass, but lean mass is not the same as skeletal muscle or strength. DXA, MRI and functional assessments answer different questions. The often-quoted 25% describes lean tissue's share of weight lost, not a loss of one quarter of a person's muscles.
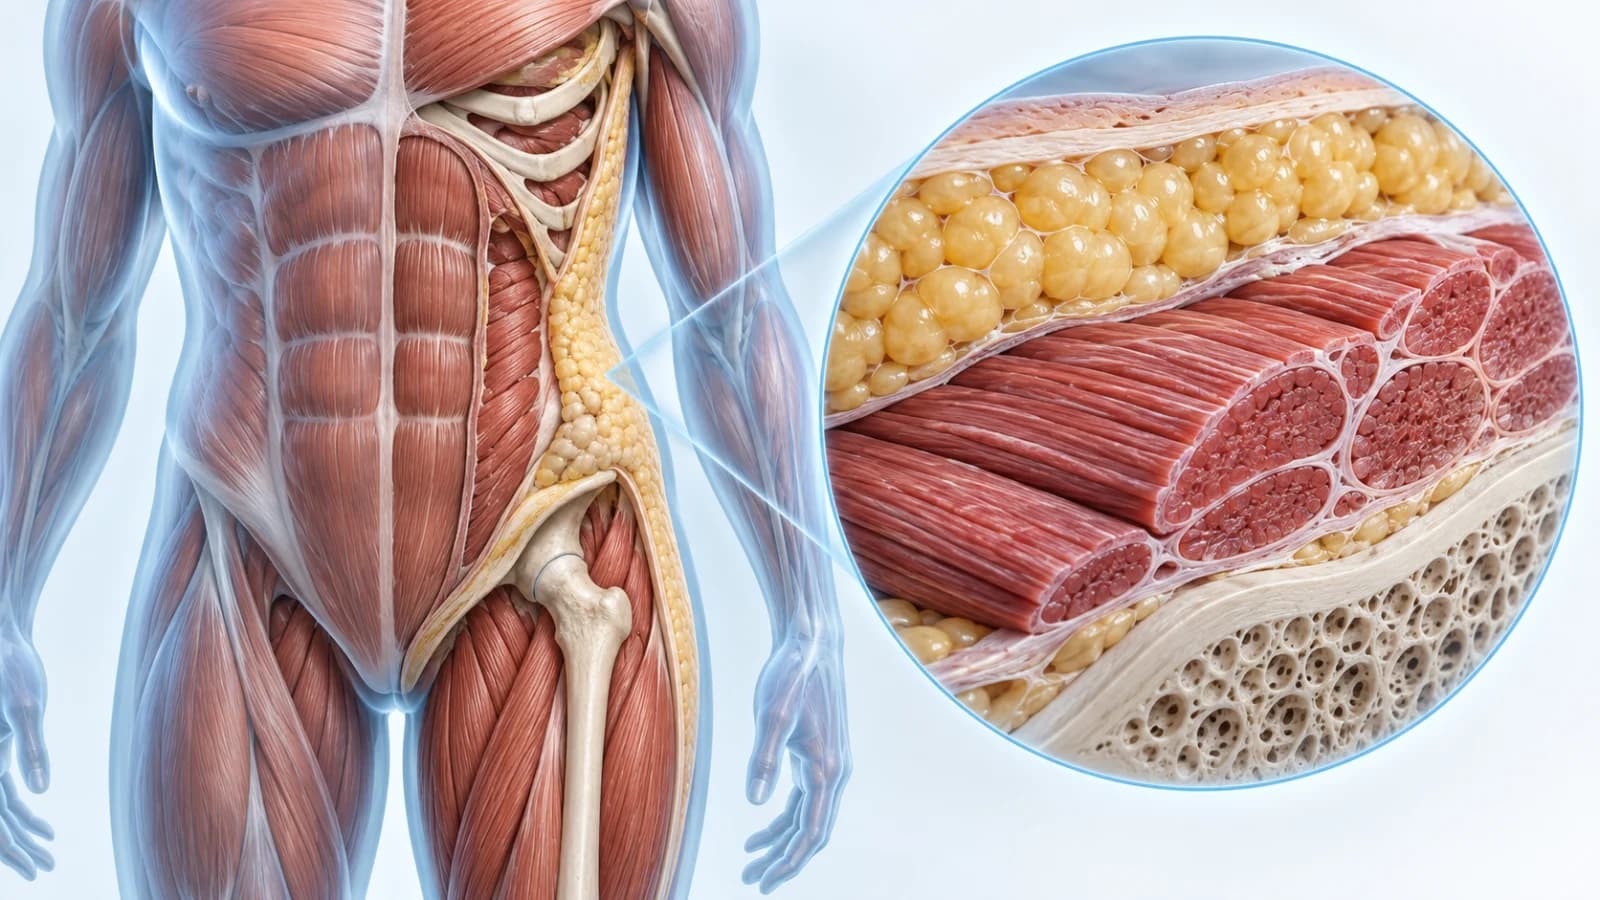
Body-composition illustration, not a patient scan or a treatment-result comparison.
On this page
- 01Yes, lean mass can fall. That is not the whole answer.
- 02What a body-composition result actually measures
- 03The SURMOUNT-1 results behind the headline
- 04How 25% turns into the wrong story
- 05MRI adds a different part of the picture
- 06Strength deserves its own evidence
- 07What a supplier can establish—and what it cannot
- 08A better way to use the research
1. Yes, lean mass can fall. That is not the whole answer.
The muscle-loss question usually arrives with a number attached: "A quarter of the weight you lose is muscle." For someone considering treatment, that sounds alarming. For a clinic preparing patient information, it sounds like a claim that needs answering. For a supplier, it can become an invitation to promise that its product somehow avoids the problem.
All three conversations need a better starting point. Which tissue was measured? A quarter of what? And did the study test what people could actually do, or only what a scan estimated?
Tirzepatide research does document changes in body composition. Ignoring lean tissue because the weight result looks impressive would be a mistake. Equally, turning every kilogram labelled "lean" into a kilogram of lost muscle overstates what the measurement establishes.
Separate three questions
- Quantity: How much fat and lean tissue changed during follow-up?
- Composition: Did the characteristics of the muscle itself change, including fat within it?
- Function: Did strength, mobility or the ability to perform everyday tasks change?
A useful article has to keep those questions separate long enough to answer them. Otherwise, a finding about one gets used to reassure or frighten people about another.
This review focuses on the evidence behind the headlines and the decisions that evidence can support. It does not offer an injection schedule, a personalised nutrition prescription or a claim that one supplier's tirzepatide preserves muscle better than another's.
Start with the denominator: A percentage of weight lost, a percentage of starting lean mass and a percentage of total body weight are different calculations. They can all be correct while telling very different stories.
2. What a body-composition result actually measures
"Muscle" is convenient shorthand. In a research table it can be the wrong noun.
Whole-body DXA separates bone mineral, fat and lean soft tissue. That last category includes muscle but is not restricted to it. A small validation study comparing creatine dilution, MRI and DXA illustrates why estimates of total skeletal muscle and total lean body mass should not be treated as interchangeable measurements.[1]
Swipe to view all columns
| Measurement in a report | The question it helps answer | The shortcut to avoid |
|---|---|---|
| DXA lean soft tissue | How did the estimated non-fat, non-bone compartment change? | Calling the entire compartment skeletal muscle |
| MRI muscle volume | How did the imaged muscle region change in size? | Assuming a regional volume represents every muscle |
| MRI muscle fat infiltration | How did fat within the assessed muscle change? | Treating composition as a direct strength test |
| Grip strength or other performance testing | What happened on a defined functional task? | Assuming one task describes all daily capabilities |
This is not an argument against scanning. It is an argument for retaining the name of the measurement when explaining its result.
Imagine a report that says a participant's lean soft tissue fell while their body-fat percentage also fell. There is no contradiction. A person can have less lean tissue in kilograms and a higher proportion of their remaining weight classified as lean. The two columns use different denominators.
Before comparing two reports, check the method
A clinic might receive a hospital DXA report, a gym's impedance printout and a smart-scale estimate from the same person. Copying all three into a single trend line creates an appearance of precision without demonstrating that the numbers are comparable. Keep the device, measurement method and test conditions attached to the result. Ask the interpreting professional whether a change is larger than the uncertainty of that particular measurement.
For a research team, this also affects study planning. Decide whether the endpoint is tissue quantity, tissue composition or physical performance before collecting data. Adding a muscle-preservation headline after the study has finished is much easier than collecting the measurements needed to justify it.
3. The SURMOUNT-1 results behind the headline
The SURMOUNT-1 DXA substudy analysed 160 participants with baseline and follow-up scans: 124 receiving pooled tirzepatide doses and 36 receiving placebo. Participants had obesity or overweight without type 2 diabetes. The principal body-composition comparison was at 72 weeks.[2]
Swipe to view all columns
| Mean change from baseline | Pooled tirzepatide | Placebo |
|---|---|---|
| Body weight | −21.3% | −5.3% |
| Fat mass | −33.9% | −8.2% |
| Lean mass | −10.9% | −2.6% |
Each row uses its own baseline compartment. These are not three pieces of one percentage pie. The authors estimated that approximately three quarters of the weight reduction was fat and one quarter lean mass in both groups. Participants received lifestyle counselling; there was no specific strength-training protocol. The study was funded by Lilly.[2]
What belongs beside the table
The participant count is the count for the DXA analysis, not the much larger parent trial. The dose groups are pooled here; this table is not a dose-by-dose muscle-loss comparison. And the mean is not an individual prediction.
Those qualifications matter in an ordinary consultation. Someone whose scan differs from the group mean has not necessarily had an abnormal result. Conversely, being close to the mean does not resolve a complaint of weakness. The patient's circumstances still determine what needs investigation.
For a commercial presentation, the fairest summary is also the most durable one: fat and lean compartments both changed, and the fat reduction was greater. There is no reason to hide the lean result. There is also no basis for relabelling its entire change as a direct measurement of lost skeletal muscle.
If a slide contains only a dramatic percentage, ask for the original table rather than arguing over the headline. Population, method, follow-up and comparator should travel with the figure. Those four details make the result usable outside the marketing sentence in which it first appeared.
4. How 25% turns into the wrong story
The easiest way to understand the denominator problem is to use a deliberately simplified example. The following numbers are invented for arithmetic only. They are not a participant record, a trial average or a forecast of what will happen on treatment.
Swipe to view all columns
| Hypothetical compartment | Before | After | Change |
|---|---|---|---|
| Fat mass | 40 kg | 25 kg | −15 kg |
| Lean soft tissue | 57 kg | 52 kg | −5 kg |
| Bone mineral | 3 kg | 3 kg | 0 kg |
| Total | 100 kg | 80 kg | −20 kg |
The lean share of the weight reduction is 5 divided by 20, or 25%. The reduction relative to starting lean tissue is 5 divided by 57, or approximately 8.8%. Meanwhile, lean tissue rises from 57% to 65% of total body weight, despite falling in absolute kilograms.
None of those calculations says the person lost 25% of their starting muscles. None tells us whether they became stronger or weaker. The arithmetic describes the compartments we assigned to the example and nothing beyond them.
Units deserve the same attention as percentages
The SURMOUNT-1 body-composition paper has a published correction: the fat- and lean-mass y-axis labels in Figure 4 should read kilograms rather than percent change. It is an axis-label correction, not a retraction of the study's overall conclusions. Readers using that figure should consult the correction, linked in the references.[3]
Read the label before the headline: Do not compare a change in kilograms with a change in percent as though they were the same endpoint. A correctly copied number can still become a false claim when its unit is dropped.
This is particularly important when a chart is cropped for a presentation or translated into another language. The visible number may survive while the denominator disappears. Keep the unit in the column heading, not only in a footnote that will be lost in the next screenshot.
The practical payoff is substantial: a clear explanation can address the concern without dismissing it or exaggerating it. That is better patient communication and better commercial communication at the same time.
5. MRI adds a different part of the picture
An MRI analysis from SURPASS-3 studied a different population: people with type 2 diabetes and additional metabolic characteristics. Among 246 participants with evaluable follow-up imaging, 190 received tirzepatide and 56 insulin degludec. In the pooled tirzepatide group, thigh muscle volume fell by 0.64 litres while muscle fat infiltration fell by 0.36 percentage points over 52 weeks. This was an exploratory post-hoc analysis funded by Lilly.[4]
The important combination is smaller volume and less fat infiltration. Those findings can coexist. Neither a reassuring nor an alarming single-word summary captures both.
Quantity and composition are not competitors
Suppose a reader wants to know whether the MRI findings cancel out the DXA findings. They do not need to cancel anything. The methods examine different properties, in different populations, over different follow-up periods. A change in the quality-related characteristics of a tissue does not make its quantity irrelevant. A change in quantity does not describe every aspect of its condition.
That is why "muscle preserved" needs a definition whenever it appears in a brochure. Does it mean no loss of volume? Less fat infiltration? Maintained grip strength? An improved walking task? Without an endpoint, the phrase is difficult to test and easy to misuse.
The same caution applies to "muscle damage." A lower volume measurement is not, by itself, a diagnosis of injury. A reader needs clinical context and the appropriate assessment, not a diagnosis inferred from a graph.
For research buyers, retaining this distinction prevents another common mistake: choosing a reference material or experimental model because its brochure repeats a clinical keyword. An assay measuring receptor activity cannot stand in for an assessment of physical function. Match the experiment to the question before matching a product to the experiment.
When discussing these studies with customers, name the endpoint first. "This study assessed thigh composition" is more informative than "the latest study proves muscle safety." It also invites a serious follow-up conversation instead of a debate over an absolute promise.
6. Strength deserves its own evidence
There is evidence about how people feel and function, but it needs its own labels. A SURMOUNT-1 analysis found improvements in patient-reported quality of life and physical-function measures. These questionnaires capture meaningful experiences; they are not direct tests of muscle force.[5]
A small 2026 real-world study followed 52 people receiving tirzepatide and included handgrip testing. Mean grip strength changed from 31.6 to 31.4 kg, without a statistically significant difference. It was an uncontrolled observational study, not a trial designed to prove equivalent strength before and after treatment.[6]
The distinction matters. "No statistically significant difference" does not prove that no one lost strength, and it does not establish that two measurements are equivalent. A small study can be useful without resolving every uncertainty.
What does a muscle-health assessment need?
The European EWGSOP2 consensus places low muscle strength at the centre of identifying probable sarcopenia, with muscle quantity or quality helping confirm it and physical performance informing severity. Its framework is another reason not to diagnose sarcopenia from one lean-mass percentage alone.[7]
For a clinical conversation, useful questions are concrete: Has rising from a chair become harder? Has the person's usual activity changed? Are they struggling to eat adequately? What measurements would help distinguish an altered scan from a meaningful functional decline?
Those are questions for assessment, not instructions to self-adjust medication. A clinician can consider the person's starting condition, dietary intake, activity, symptoms and other treatments together. An online percentage cannot do that work.
Clinical Warning: New weakness, a marked decline in day-to-day function or difficulty maintaining food and fluid intake deserves clinical review. Do not treat a favourable average from a study as a reason to ignore an individual's symptoms.
For an organisation designing follow-up, consistency is more useful than collecting every possible number. Record what was assessed, by whom and under what conditions. If the method changes halfway through follow-up, make that visible rather than presenting a seamless trend that the data do not support.
7. What a supplier can establish—and what it cannot
The clinical concern creates a predictable procurement question: "Is there a better-quality tirzepatide that will not cause muscle loss?"
That question combines product quality with treatment outcome. They are related parts of responsible practice, but they are not interchangeable evidence. A batch test can help establish identity or a defined analytical attribute. It cannot establish a muscle-preservation outcome in people who have not been studied with that product.
For tirzepatide specifically, do not substitute molecular similarity, a familiar vial strength or a chromatographic percentage for evidence about the supplied finished product. A trial of a named investigational or authorised formulation does not become a clinical trial of every vial sold under the molecule's name.
Compare supply offers on things a supplier can actually deliver
- A defined specification: The quotation should state what is supplied, including the form, labelled quantity and relevant test documentation.
- A traceable batch: Keep the batch identity connected to the material received and the documents reviewed.
- A workable validation order: Establish how an evaluation lot leads to a repeat order using the same agreed specification.
- A written delivery scope: Record the destination, delivery responsibilities and documents, rather than inferring them from a price alone.
LeewayGo's offer is factory-direct supply, Tier-1 wholesale pricing without middleman markup, verified ≥99% HPLC/MS purity, low-MOQ testing and door-to-door DDP customs clearance. Start with the 10-vial evaluation route when it fits the project, then request a volume quotation against the same specification. These are commercial supply commitments, not a guarantee of an individual treatment result.
That separation is good for buyers. It makes the quote easier to compare and prevents an appealing clinical headline from doing the work of a missing specification. It is also good for suppliers: a clear manufacturing and logistics offer is stronger than an unsupported promise about preserving every kilogram of muscle.
If your question is clinical, bring the evidence to the treating team. If your question is procurement, bring the product form, quantity, documentation requirements and destination to the supplier. Keeping the two conversations connected but distinct saves time on both sides.
8. A better way to use the research
The useful answer is neither "muscle loss is a myth" nor "weight loss on tirzepatide is mostly muscle." Both flatten several measurements into a slogan.
A better reading starts with the result's name and ends with the decision it can support. DXA informs body-composition change. MRI adds regional information about muscle. Functional assessments address what a person can do. None becomes more convincing when relabelled as another.
Build a short evidence note, not a pile of headlines
For each paper you intend to discuss, record the population, measurement, comparator and follow-up. Add one sentence describing its main limitation for your question. If your concern is strength and the paper contains only a scan, write that down. If it contains a questionnaire, retain that label. If it is observational, do not present it as a randomised comparison.
Keep arithmetic examples separate from observed results. A hypothetical table is useful for explaining a denominator precisely because it is not pretending to predict a patient. Label it clearly and use it to teach the calculation, then return to the actual study for clinical evidence.
For clinics, the next useful step is a follow-up conversation that includes function and symptoms, not just a target weight. For research teams, it is an endpoint that matches the question. For distributors and bulk buyers, it is a supply brief that does not ask an analytical certificate to prove a clinical outcome.
The links below connect this evidence review to the wider Tirzepatide hub and the original papers. When requesting a LeewayGo quotation, specify the required material and order scope; the clinical numbers in this article are not a substitute for those details.
Read the tissue label. Keep the denominator. Ask about function. Those three habits take most of the confusion out of the muscle-loss conversation without pretending that one study answers everything.
Additional sources & related reading
Full-text study material and the published axis-label correction. Numbered journal references appear below the FAQ.
- SURMOUNT-1 body composition: full paper and methods (opens in a new tab)
- Published correction: Figure 4 axes use kg, not % (opens in a new tab)
Continue within the Research Hub
Choose the right sourcing path
Factory-direct access for trial validation and commercial scale, backed by batch documentation and DDP delivery.
Resellers / Individuals
Low MOQ Factory-Direct Trial
Order 10+ Vials at Factory Pricing, Ready-to-Ship Inventory
Start a Trial OrderClinics / Bulk Buyers
Tier-1 Commercial Wholesale & Private Label
Full Batch COA, Custom Lyophilization, DDP Air Freight
Request Commercial QuoteFrequently asked questions
Does tirzepatide cause muscle loss or only fat loss?
Weight reduction can include both fat and lean tissue. Lean tissue is not identical to skeletal muscle, and a scan alone does not establish what happened to strength. Interpret body-composition findings alongside the person's clinical circumstances and functional assessment.
Does the 25% figure mean losing a quarter of your muscles?
No. It describes lean tissue's approximate share of the weight reduction, not the proportion of starting skeletal muscle lost. The denominator matters: lean kilograms lost divided by total kilograms lost is different from lean kilograms lost divided by starting lean mass.
Can a normal grip-strength result rule out all muscle problems?
No. Grip strength is one defined task. It adds information that a body-composition scan does not provide, but an individual's symptoms, other functional measures and clinical context still matter.
Can higher-purity tirzepatide guarantee muscle preservation?
No. Analytical purity and individual treatment outcomes are different questions. A batch certificate does not establish a muscle-preservation benefit. Request identity and quality documentation for procurement, and discuss treatment outcomes with the prescribing clinician.
How do I request a factory-direct evaluation order from LeewayGo?
Use the trial inquiry for a 10-vial evaluation request or the wholesale inquiry for bulk requirements. Send the product form, specification, quantity, destination and required documents. Ask for the written Tier-1 price and DDP delivery scope; these supply terms do not establish clinical equivalence to a trial product.
Clinical & technical references
View 7 cited sources
- 1.
Creatine (methyl-d3) dilution in urine for estimation of total body skeletal muscle mass: accuracy and variability vs. MRI and DXA. Journal of Applied Physiology, 2018. PubMed
- 2.
Body composition changes during weight reduction with tirzepatide in the SURMOUNT-1 study of adults with obesity or overweight. Diabetes, Obesity and Metabolism, 2025. PubMed
- 3.
Correction to ‘Body composition changes during weight reduction with tirzepatide in the SURMOUNT-1 study of adults with obesity or overweight’. Diabetes, Obesity and Metabolism, 2025. PubMed
- 4.
Tirzepatide and muscle composition changes in people with type 2 diabetes (SURPASS-3 MRI): a post-hoc analysis of a randomised, open-label, parallel-group, phase 3 trial. The Lancet Diabetes & Endocrinology, 2025. PubMed
- 5.
Association between weight reduction achieved with tirzepatide and quality of life in adults with obesity: Results from the SURMOUNT-1 study. Diabetes, Obesity and Metabolism, 2025. PubMed
- 6.
Tirzepatide in real-world clinical practice: changes in body composition and muscle function in patients with obesity. Nutrición Hospitalaria, 2026. PubMed
- 7.
Sarcopenia: revised European consensus on definition and diagnosis. Age and Ageing, 2019. PubMed